
 Image 1 of 5
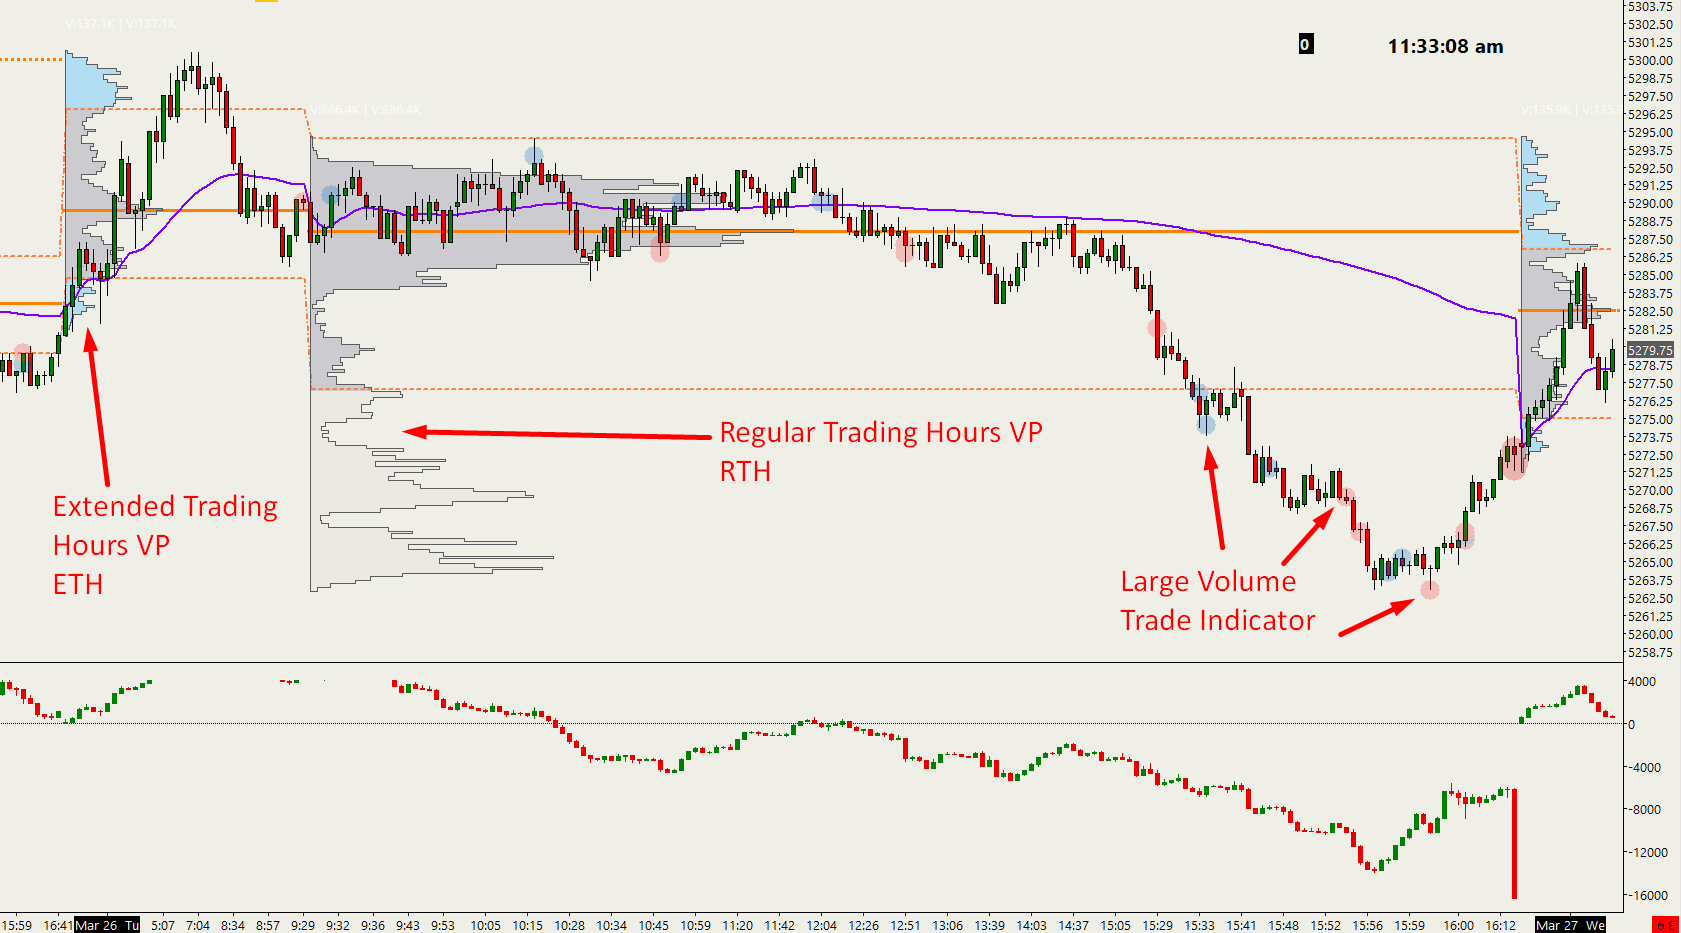 Image 2 of 5
 Image 3 of 5
 Image 4 of 5
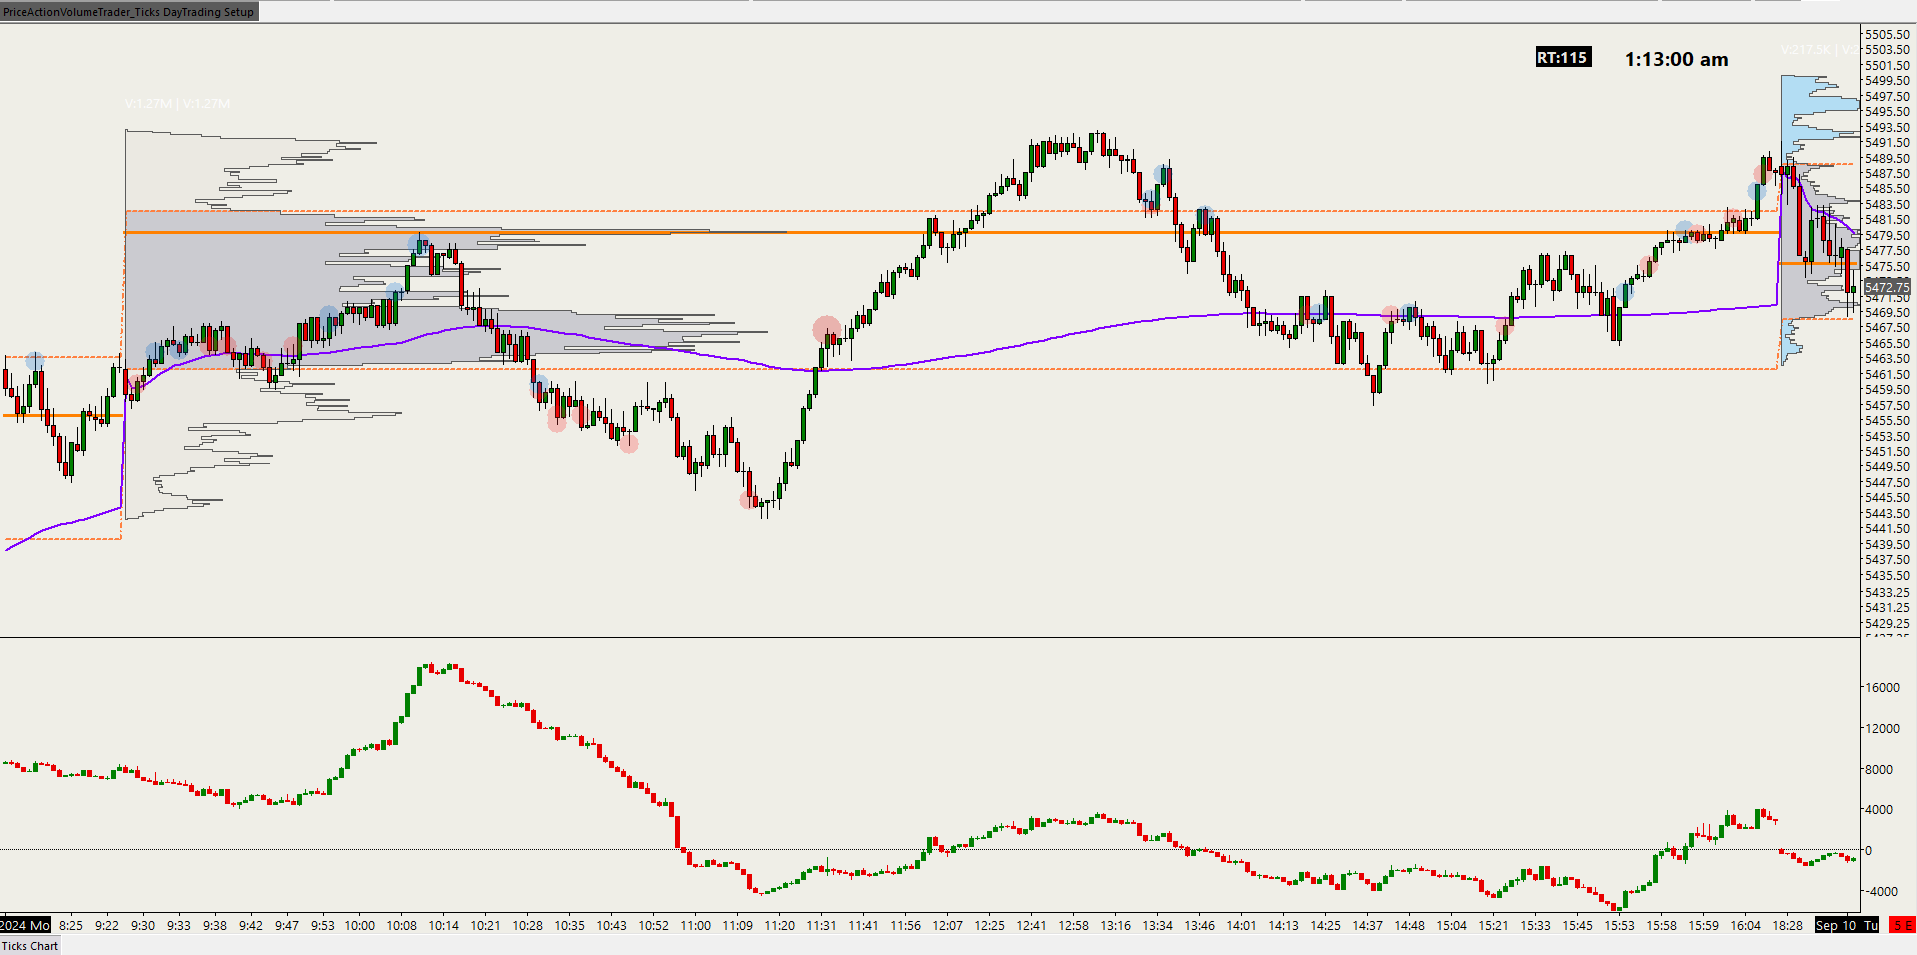 Image 5 of 5
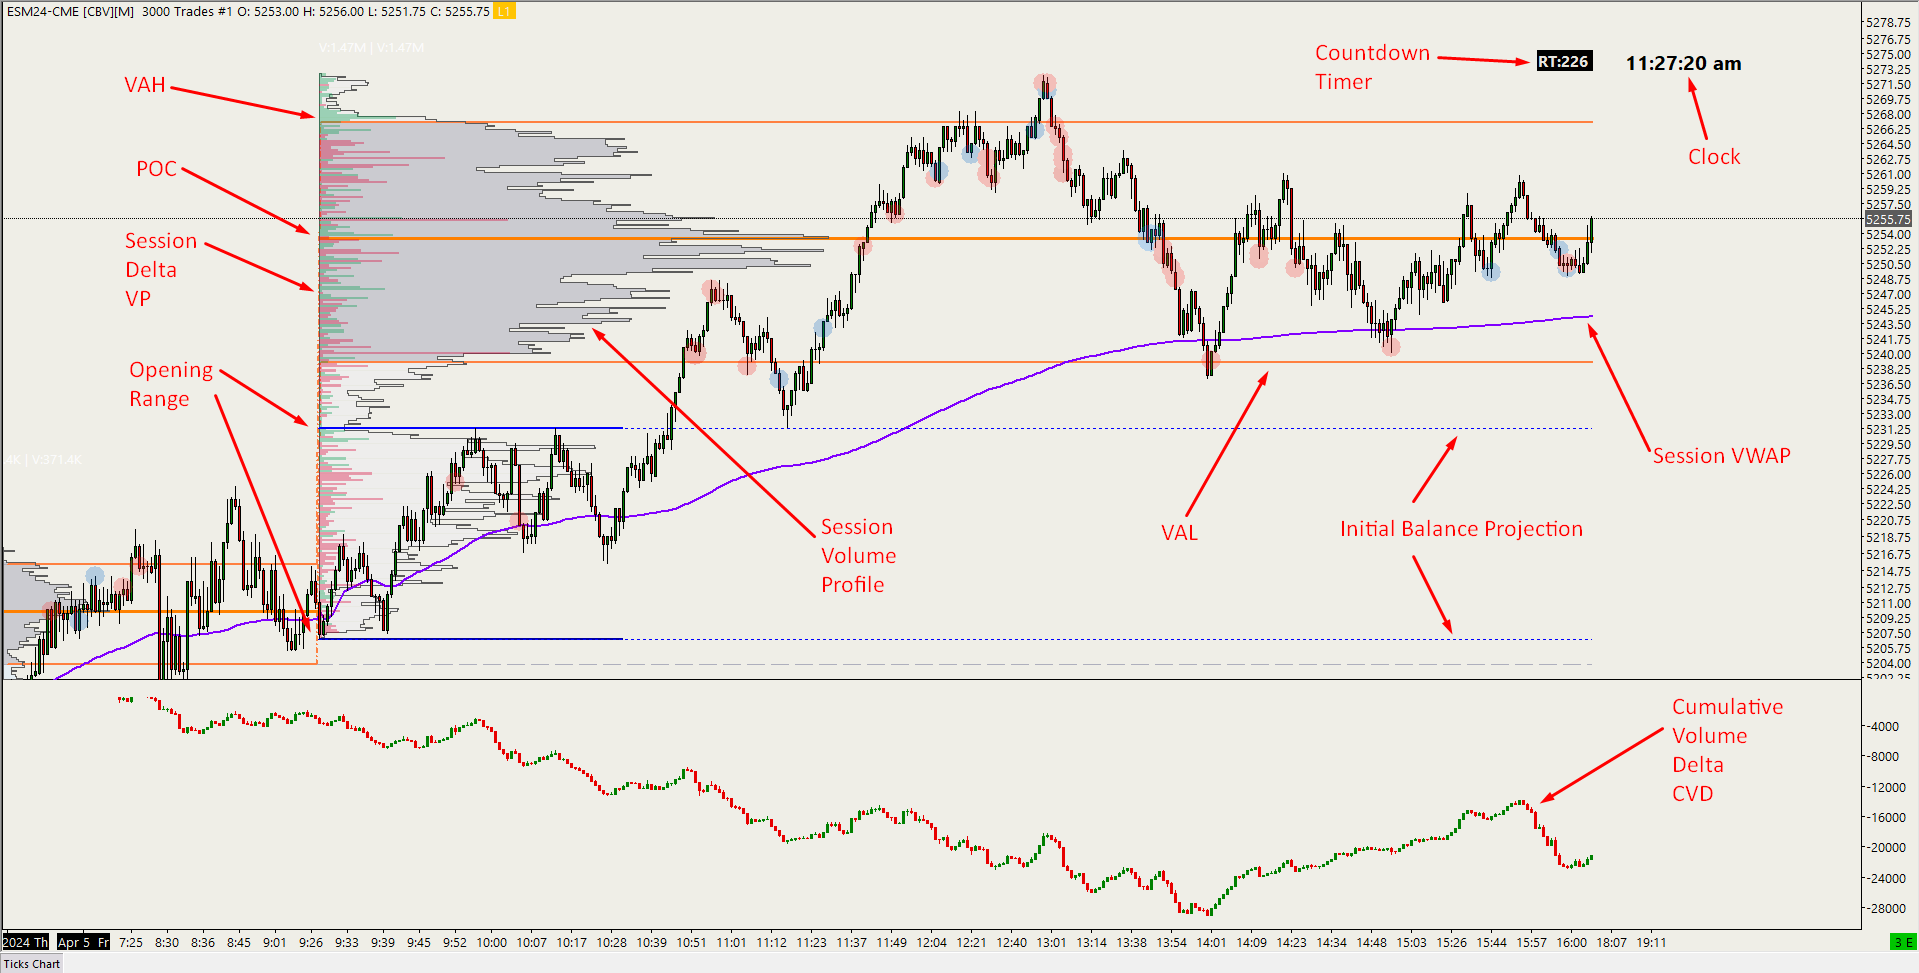
This is the setup that I use myself in my day trading charts for the futures markets using tick charts which offer a great advantage of filtering out high volatility environments which gives a much more granular view of the price action. This is especially useful during RTH market hours when volumes are high. The chart is set to the September 2026 contract of ES (SP500) but you can easily change it to whatever market and session/s hours you want.
The elements on this chart consist of:
3000 tick chart (this is what I use specifically for day trading ES (but you can easily change it in Chart, Settings, Bar Periods for other tick/time parameters or under Chart Settings - Symbol for other markets like NQ, Gold, etc)
Session VWAP (Volume Weighted Average Price) in purple
Session volume profile split for each session (Grey for RTH, Blue for ETH) and all colors can be customized
Session delta volume profile to measure absorption of aggressive buyers/sellers
Current price line
Countdown timer until next candlestick starts forming
Clock
Large volume trade indicator (I have it set for 100 contracts) which can be changed to any number you want depending on markets or time of day
CVD - Cumulative Volume Delta below main chart to measure aggressive buyer/seller executions
Initial Balance for RTH marker (Solid blue lines) from 9:30am EST-10:30am EST
Initial Balance (IB) extension lines (dotted blue lines) for the rest of the current RTH session
The color/font settings can be customized under the individual Chart Graphic Settings. They are not set to follow the Global Graphic Settings of your system, but rather the individual chart settings. You may override that by checking the box in the individual Chart Graphic Settings that says “Use Global Graphic Settings instead of these settings” so it will have the same look as any other charts on your system.