This is a basic 5 chart combo of 5 popular time based charts all together: 1m, 5m, 1H, Daily and Weekly. This file is completely customizable and is preset to the September 2026 contract in ES SP500 futures), but you can switch it to any other market in futures, forex, crypto, stocks, etc. The charts have all been linked to the same symbol number, so if you change the symbol on any chart, the rest will change with it. Also the drawings are synchronized to copy onto the other charts on lower timeframes. So for example if you make a horizontal support line on the daily chart, it will show up in the 1h, 5m and 1m charts (not the weekly), etc.
The color/font settings can be customized under the individual Chart Graphic Settings. They are not set to follow the Global Graphic Settings of your system, but rather the individual chart settings. You may override that by checking the box in the individual Chart Graphic Settings that says “Use Global Graphic Settings instead of these settings” so it will have the same look as any other charts on your system.
Each chart has specific studies/indicators already applied to it:
1m/5m: price line, candle countdown timer, clock, CME futures RTH opening range marker (9:30am-10:30am EST)
1h: price line, candle countdown timer, daily open marker
Daily: price line, 50 MA, 200 MA
Weekly: price line
These chart combo is meant to be a great starting point for you to customize and adjust settings as you wish as these charts can adapt to any market. You can change settings under studies and also hide any indicators you don’t always want on. Like for example the futures opening range which would not be useful for other markets unless you adjust the settings for it.

 Image 1 of 6
 Image 2 of 6
 Image 3 of 6
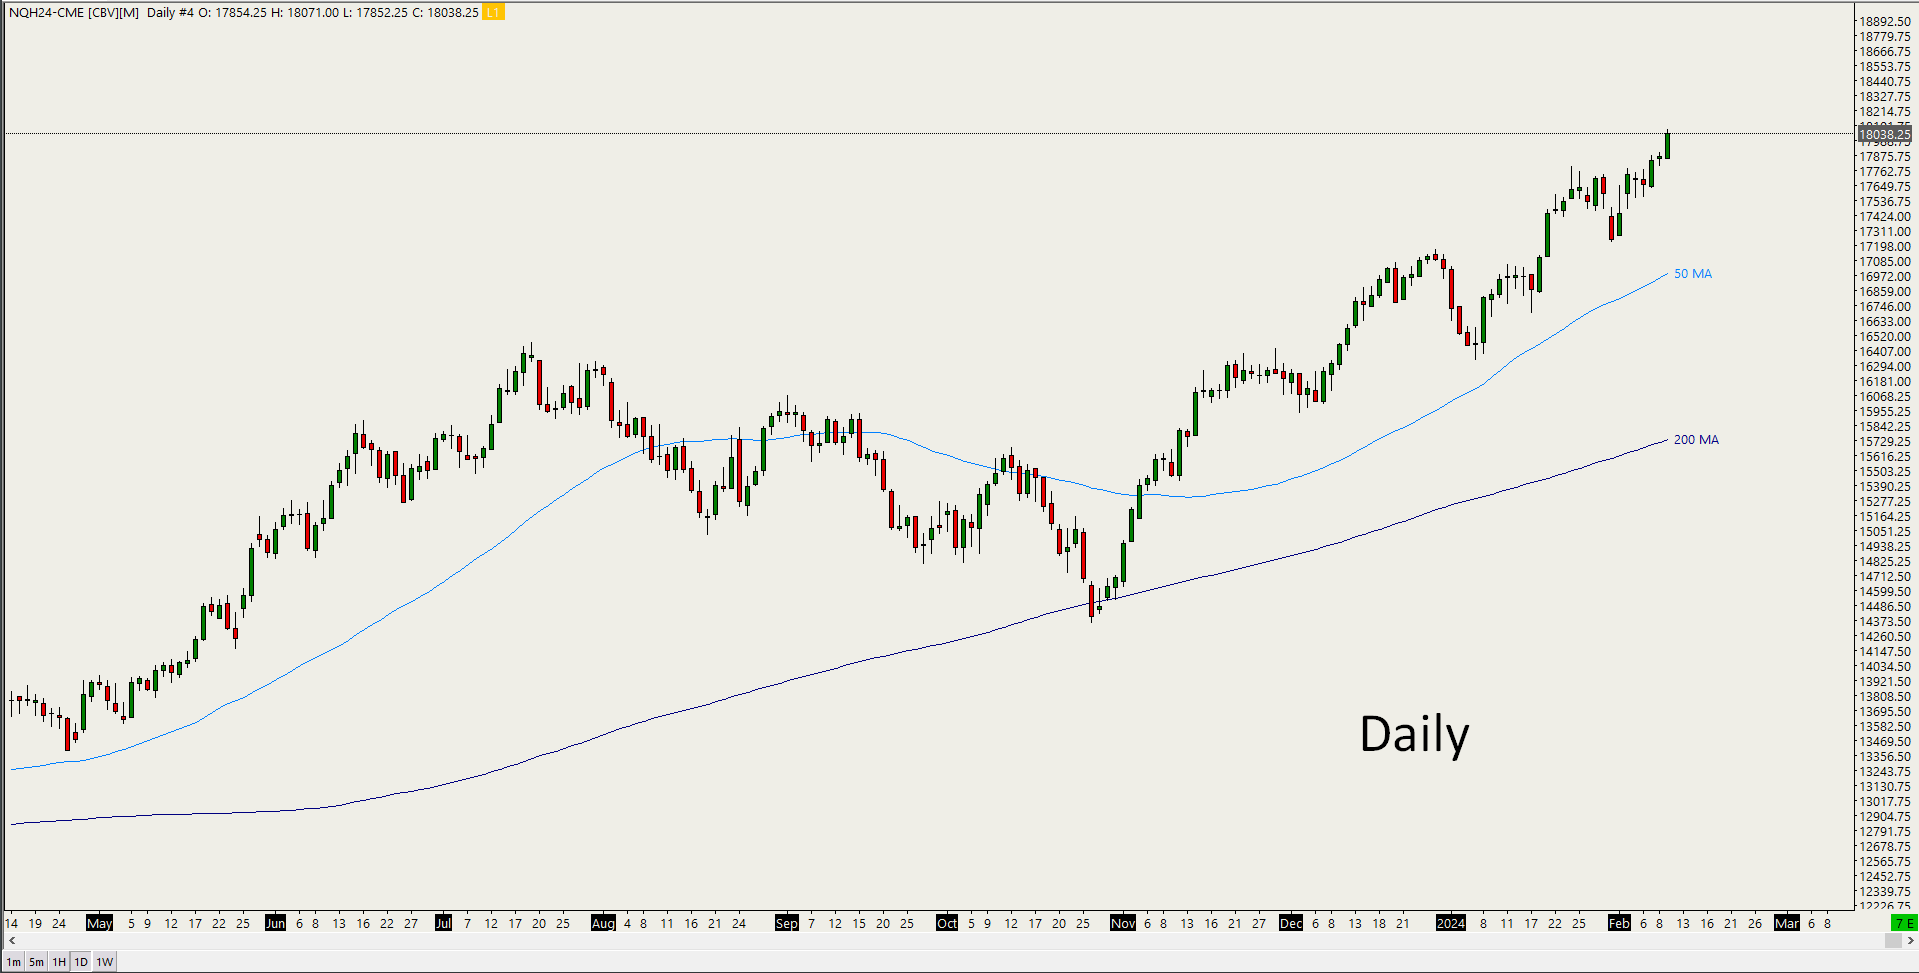 Image 4 of 6
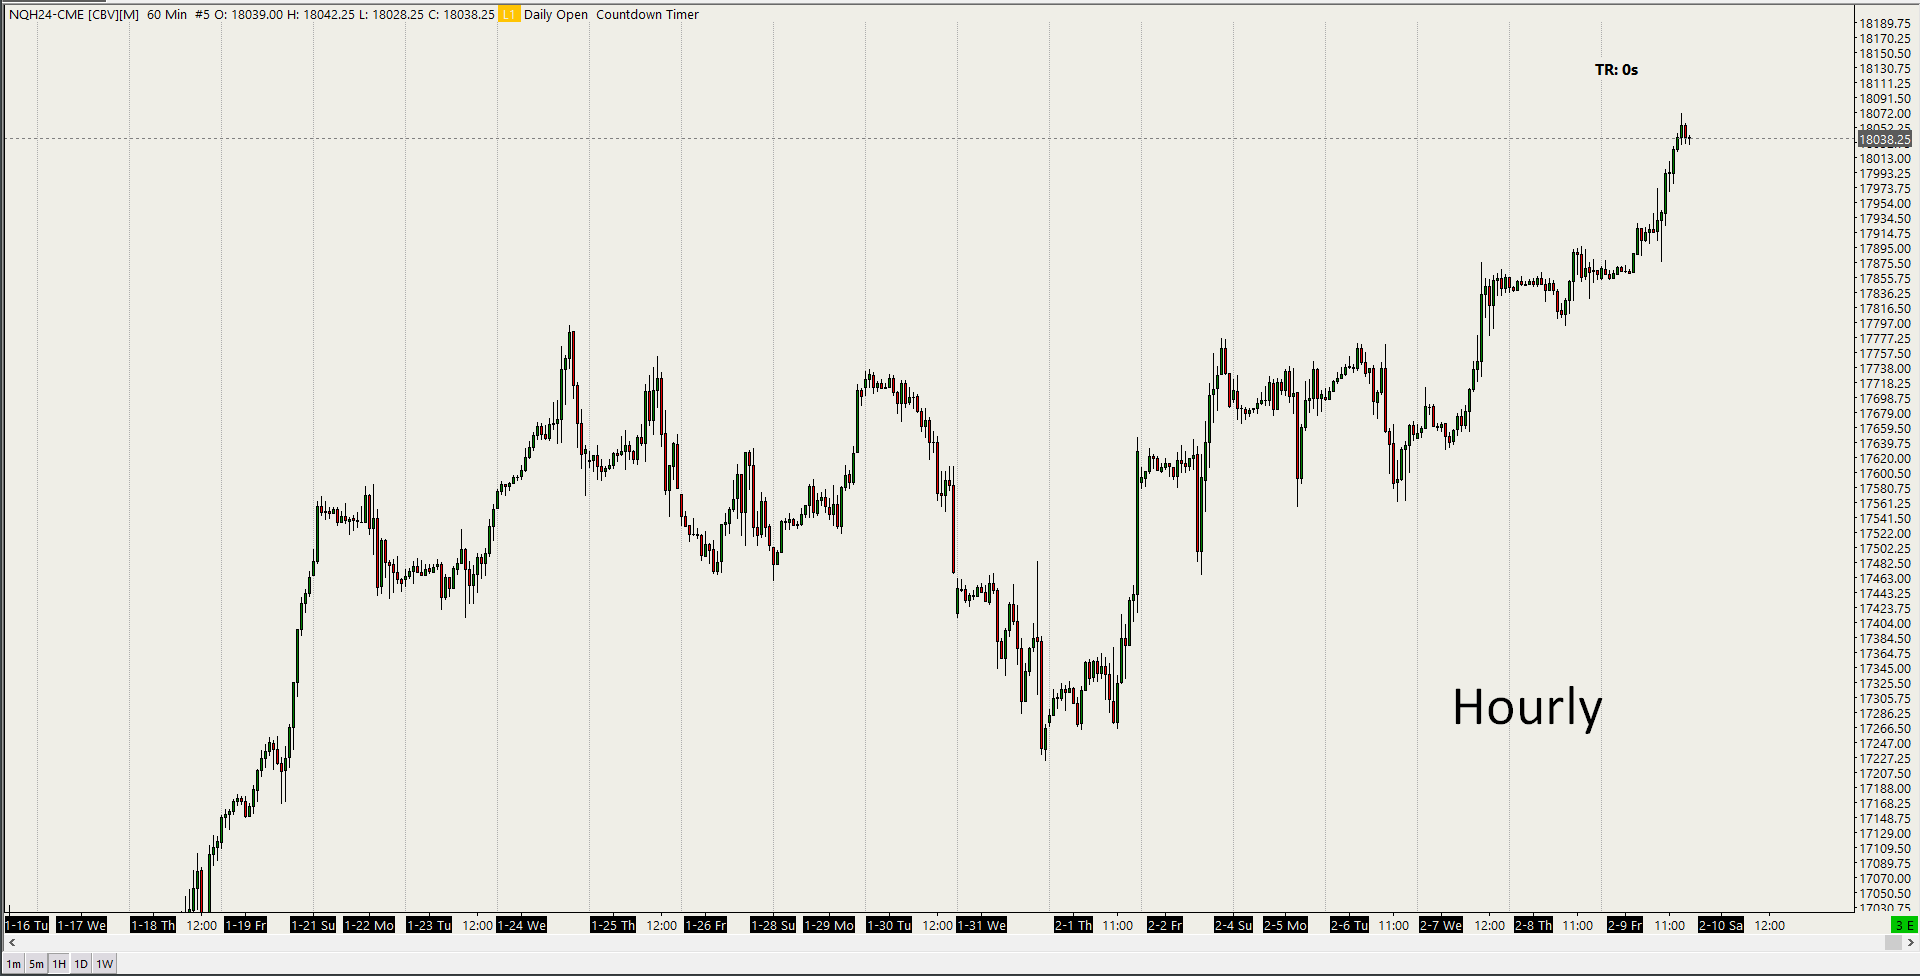 Image 5 of 6
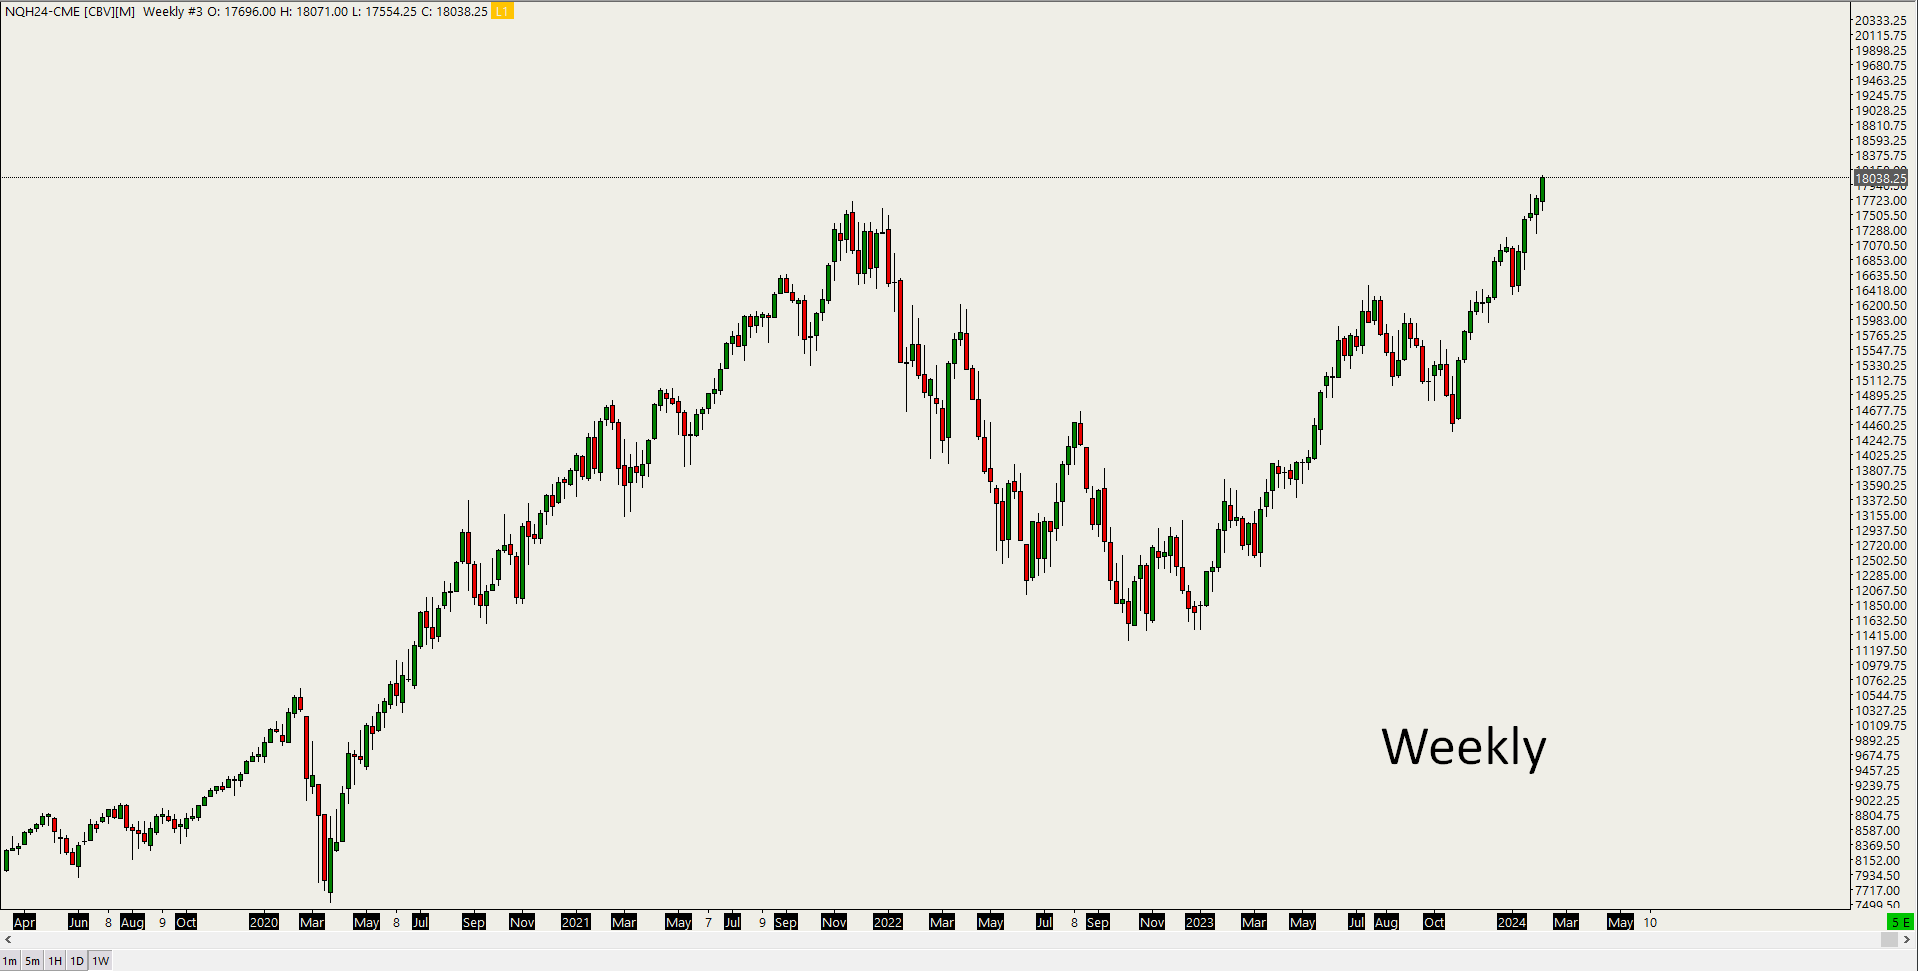 Image 6 of 6