
Triple Drive MACD Reversal Detector
High-Probability Exhaustion & Turning Point Signals
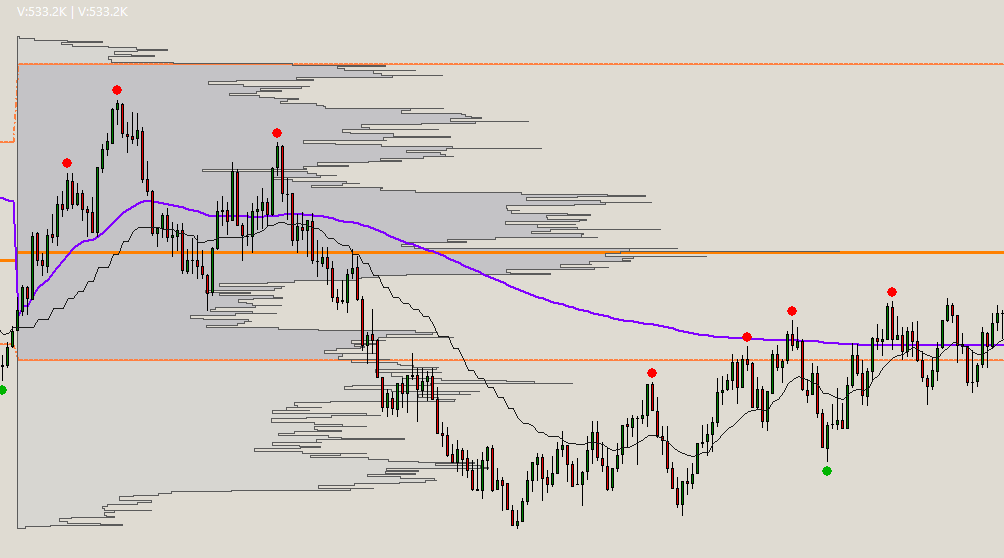
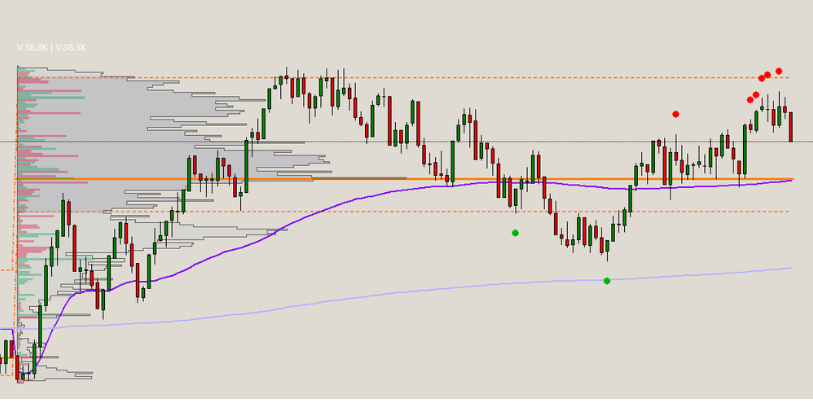
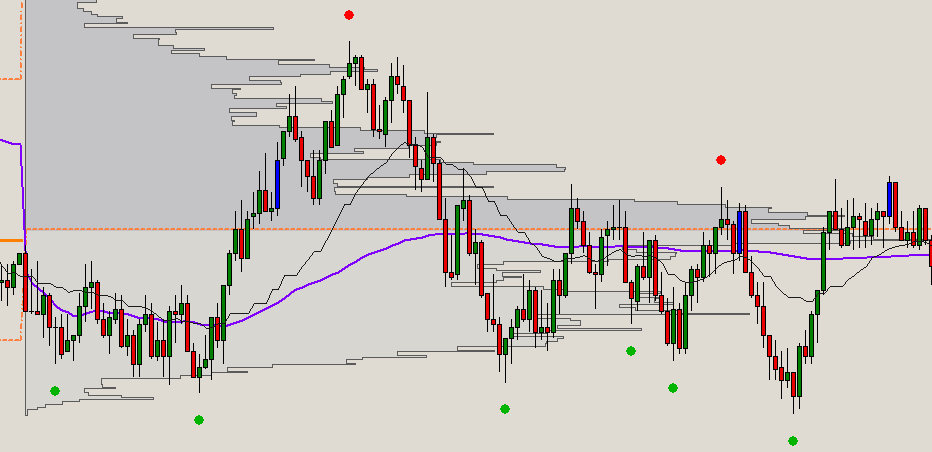
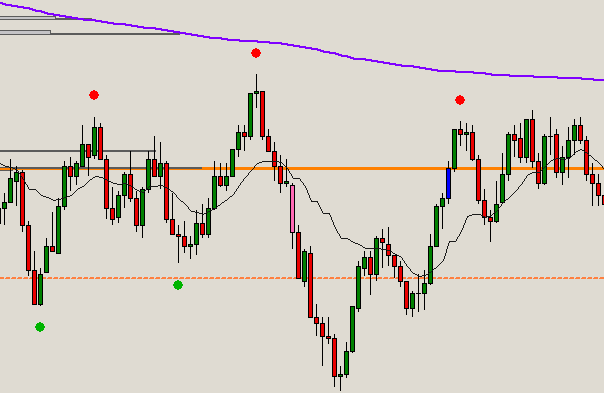
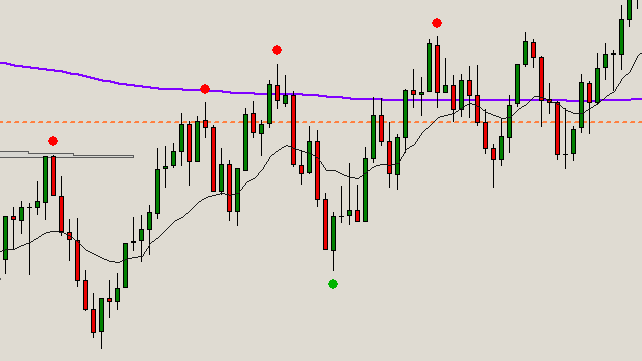
The PAVT Triple Drive + MACD Divergence scans for structured price movements that form the classic Triple Drive reversal pattern, incorporating Fibonacci relationships for symmetry and proportion, along with MACD divergence to confirm weakening momentum.When a completed pattern meets the internal criteria, it places a clear dot at the potential turning point:
Red dot = Bearish reversal (potential short)
Green dot = Bullish reversal (potential long)
The indicator focuses on high-probability exhaustion zones where price has made three drives and momentum is fading — all calculated automatically in the background.
The indicator is optimized for the fast-paced environments of tick charts while also remaining fully flexible for 1-minute and 5-minute timeframes.
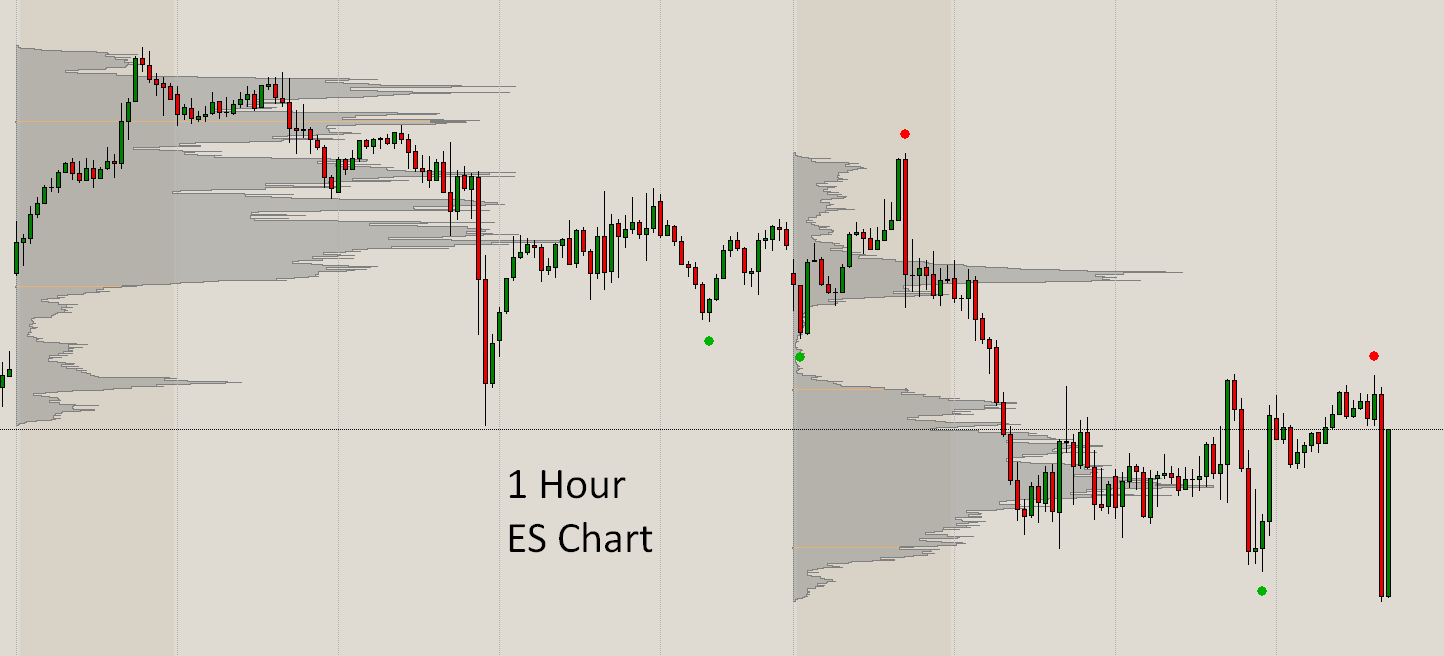
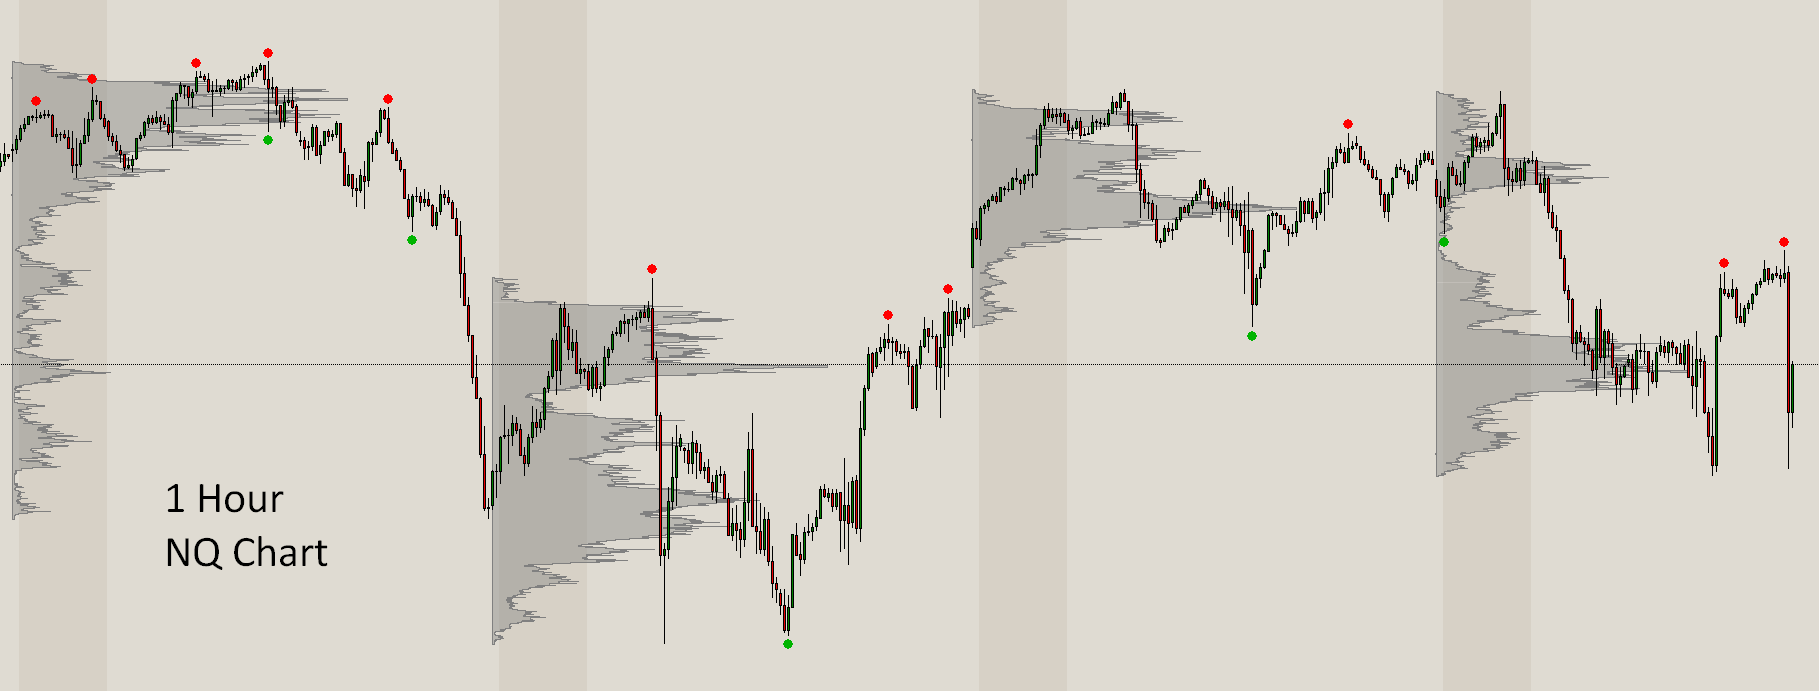
It can also be applied into HTF charts such as a 1H timeframe for swing trading opportunities or better intraday bias to execute on the lower timeframes.
Whether you trade aggressive intraday scalps or swings, the Triple Drive Detector helps you spot exhaustion moves where momentum is weakening and smart money is likely reversing.
This is the exact indicator I use in my own trading alongside my other custom Sierra Chart tools.
This indicator works on any market and any Sierra Chart package — including the basic Sierra Chart plans. No Advanced Package or market depth is required.
Works Great On:
Futures (ES, NQ, YM, GC, CL, etc.)
Forex (EURUSD, GBPUSD, etc.)
Stocks & Indices
Crypto (BTC, ETH, etc.)
Any decentralized or centralized market
Includes all future updates and an in depth video guide explaining how to install the .dll study files in your system and what each setting does.
Available for Windows, Intel Macs, and Apple Silicon Macs!
Features:
Pure Price Action Based: Combines swing structure analysis, Fibonacci relationships, and MACD momentum — no volume, delta, or market depth required
Universal Compatibility: Works on all Sierra Chart packages (Standard or Advanced) and on any market — Futures, Forex, Stocks, Indices, and Crypto
Triple Drive Pattern Detection: Automatically identifies high-probability Triple Drive reversal formations using precise swing symmetry
Fibonacci Ratio Analysis: Incorporates key Fibonacci retracement and extension levels in the pattern recognition process for improved accuracy
MACD Divergence Confluence: Adds momentum exhaustion confirmation to filter for higher-quality reversal setups
Clean Visual Signals: Small, non-repainting red dots (bearish reversals) and green dots (bullish reversals)
Smart Vertical Offset Control: Dedicated setting to adjust dot vertical placement
Highly Customizable: Adjust swing strength, minimum swing size, Fib tolerance, MACD settings, and more to match your trading style
Optimized for Fast Markets: Excellent on ES 3000 Tick and NQ 1500 Tick charts, while remaining effective on 1-minute and 5-minute timeframes
Great HTF opportunities for swing trading or better intraday bias when used in the 1H timeframe.
Replay Mode Ready: Fully reliable in both live trading and replay/backtesting
Lightweight & Fast: No performance impact even on high-speed tick charts
Mac Users:
If your Mac has an Apple Silicon chip (M1, M2, M3, M4 — check Apple menu → About This Mac → Chip): use the _ARM64.dll files
If your Mac has an Intel chip: use the standard _64.dll files (they run x64 natively via Rosetta)
All Windows users use the standard _64.dll versions
If you are using Parallels or similar to run Windows on a Mac then use the standard _64.dll files
Installation Instructions:
1- After purchase, email your Sierra Chart Account Name to priceactionvolumetrader (at) gmail.com. This is mandatory as you need to be manually added into the authorized user list for the indicators to work. Also include what operating system you have (Windows, Intel MAC, Silicon MAC) to authorize you in the correct system. Please use “Custom Sierra Chart Triple Drive” on the subject line for easier identification.
2- You’ll receive an email with general information, a private Google Drive download link for the custom .dll file and the video guide within 24 hours.
3- Copy the files into your Sierra Chart data folder. By default it will be at: C:\SierraChart\Data.
4- Add the indicators to your chart by going to Analysis → Studies → Add Custom Study.
5- Select the DLL file from the list (PAVT_TripleDrive_MACD) and click Apply.
6- The studies will show on your charts and the indicator list on the right. To customize them double click on it or mark and click on settings.
7- Watch the complete video guide link sent by email.
FAQ Section
How does the indicator work? It identifies the Triple Drive reversal pattern using swing analysis, Fibonacci retracements and extensions, and MACD divergence to highlight high-probability turning points in the market.
What makes this indicator different? It combines three powerful elements — classic price action (Triple Drive), Fibonacci measurements, and momentum confirmation (MACD) — into one clean, non-repainting study.
What markets is this indicator suitable for? This is a universal price action indicator. It works on Futures (ES, NQ, YM, GC, CL, etc.), Forex pairs, Stocks, Indices, and Crypto. Since it only uses price and MACD, it performs well on both centralized and decentralized markets.
Do I need the Advanced Package or Market Depth? No. This indicator does not require market depth, bid/ask data, or the Advanced Package. It works perfectly on standard Sierra Chart plans.
What timeframes does it work best on? It is optimized for ES on 3000 Tick and NQ on 1500 Tick charts (my personal setups). It also works very well on 1-minute and 5-minute charts. You can adjust the Swing Strength and Min Swing Size to control signal frequency on any timeframe.
Does it repaint? No. Once a dot is placed on the chart, it stays there permanently.
Will the dots overlap with my other indicators? No problem. The Dot Vertical Offset setting allows you to move the dots higher or lower as needed.
Can I customize the sensitivity? Yes. All key parameters (Swing Strength, Minimum Swing Size, Fib Tolerance, MACD Divergence requirement, etc.) are fully adjustable in the Study Settings window.
Is this the same logic you use in your own trading?
Yes. This is the exact Triple Drive setup I use daily on my ES and NQ charts.How do I get access after purchase? After payment, email your Sierra Chart Account Name and operating system (Windows / Intel Mac / Apple Silicon) to priceactionvolumetrader (at) gmail.com. I will manually activate your license within 24 hours.
Do you offer support? Yes — dedicated email support is included with both plans.
Are there any prohibited uses? See the full Terms of Use & License Agreement below.
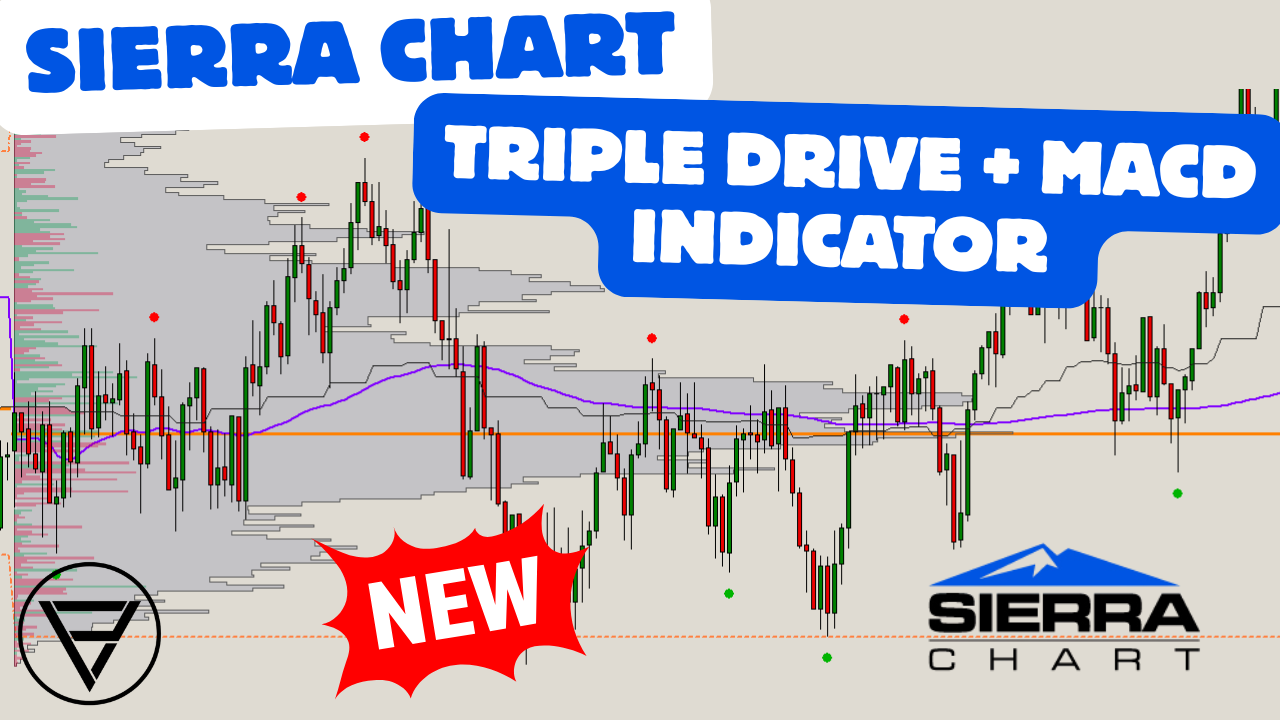
YouTube video introduction to the indicator
(Click thumbnail above)
Terms of Use & License Agreement
By purchasing and using the CVD Divergence Detector Indicator, you agree to the following terms:
License Scope
This indicator is licensed for personal, visual, and manual trading use only. It is provided as a visual aid to help traders identify potential absorption and reversal setups on Sierra Chart charts.Prohibited Uses
The following actions are strictly prohibited:Using the indicator (or any of its outputs) in automated trading systems, trading bots, algorithmic trading scripts, or any form of automated execution.
Data scraping, exporting, or programmatically reading the indicator’s signals, arrows, subgraphs, or any internal calculations for use in external software or scripts.
Reverse engineering, decompiling, disassembling, or attempting to extract the underlying logic, conditions, or source code of the indicator.
Redistributing, sharing, selling, or giving away the DLL files or any part of the indicator to third parties.
Removing or bypassing the built-in authorization check.
Ownership
All intellectual property rights in the Absorption Detector Indicator remain the exclusive property of Price Action Volume Trader. The purchase grants you a non-exclusive, non-transferable, revocable license to use the indicator on your own Sierra Chart installation(s) only.No Warranty
The indicator is provided "as is" without any warranties, express or implied. Past performance is not indicative of future results. Trading futures involves substantial risk of loss and is not suitable for all individuals. You are solely responsible for your trading decisions and risk management.Termination
We reserve the right to revoke your access at any time if these terms are violated. Upon termination, you must immediately delete all copies of the DLL files.Refund Policy
Due to the digital nature of the product, no refunds will be issued after the DLL files have been provided and authorization has been granted. Please contact us with any questions before purchasing.Billing
Billing is done through Stripe as either a one time fee or recurring monthly subscription. You can cancel the monthly plan at anytime in your Stripe dashboard or sending an email request. Includes all future indicator updates.
Changes to Terms
We may update these terms from time to time. Continued use of the indicator after changes constitutes acceptance of the new terms.
By completing your purchase, you acknowledge that you have read, understood, and agree to be bound by these Terms of Use.