
 Image 1 of 5
 Image 2 of 5
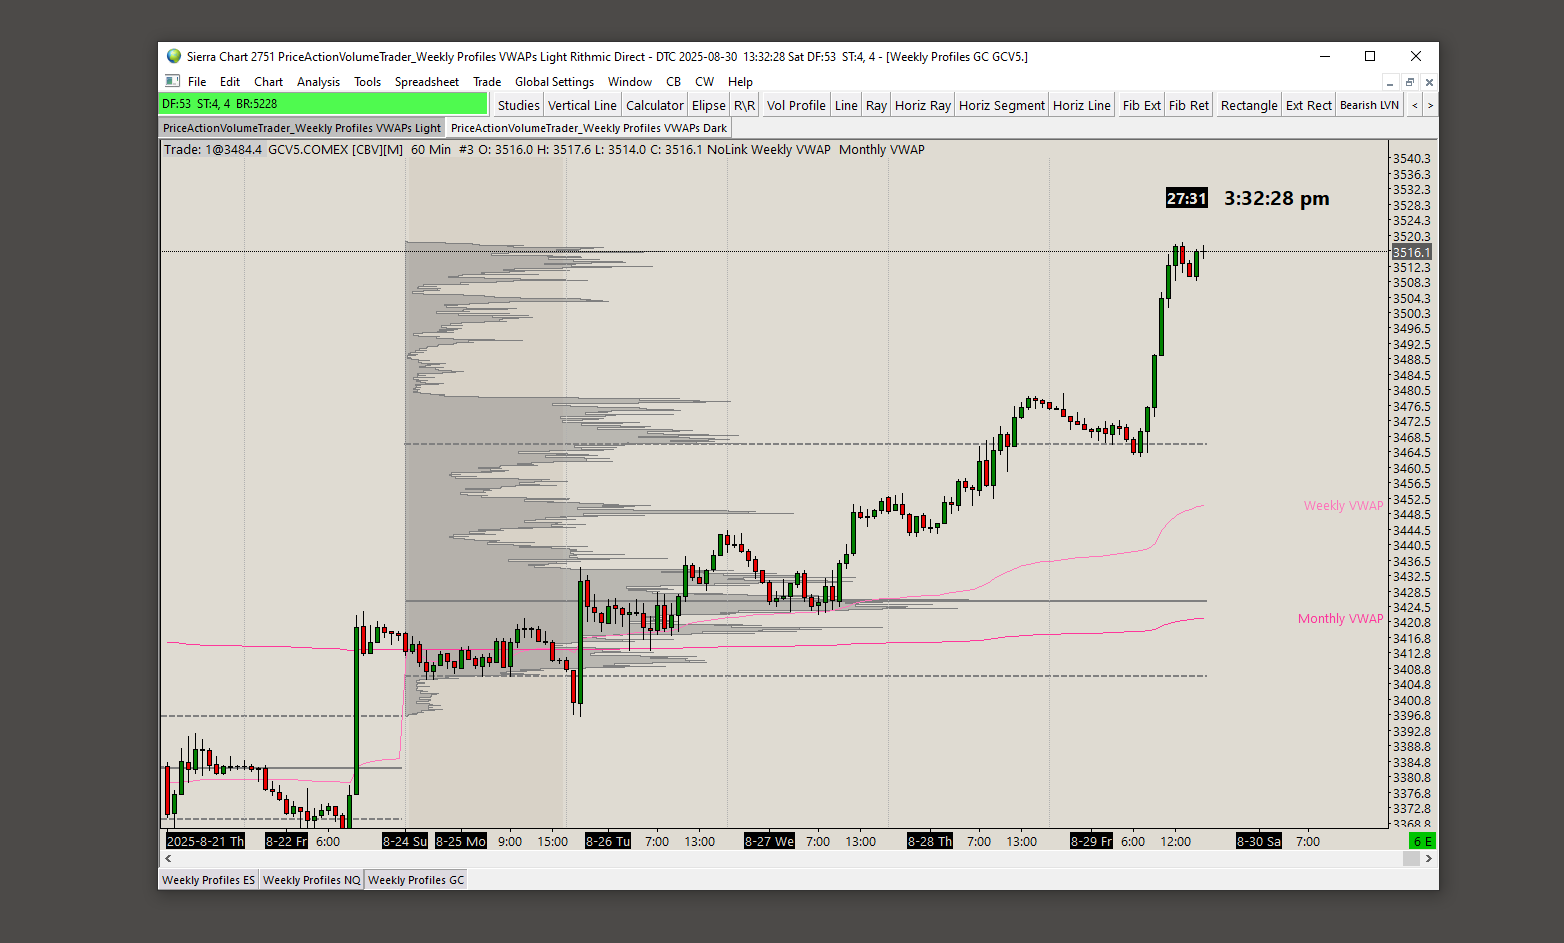 Image 3 of 5
 Image 4 of 5
 Image 5 of 5
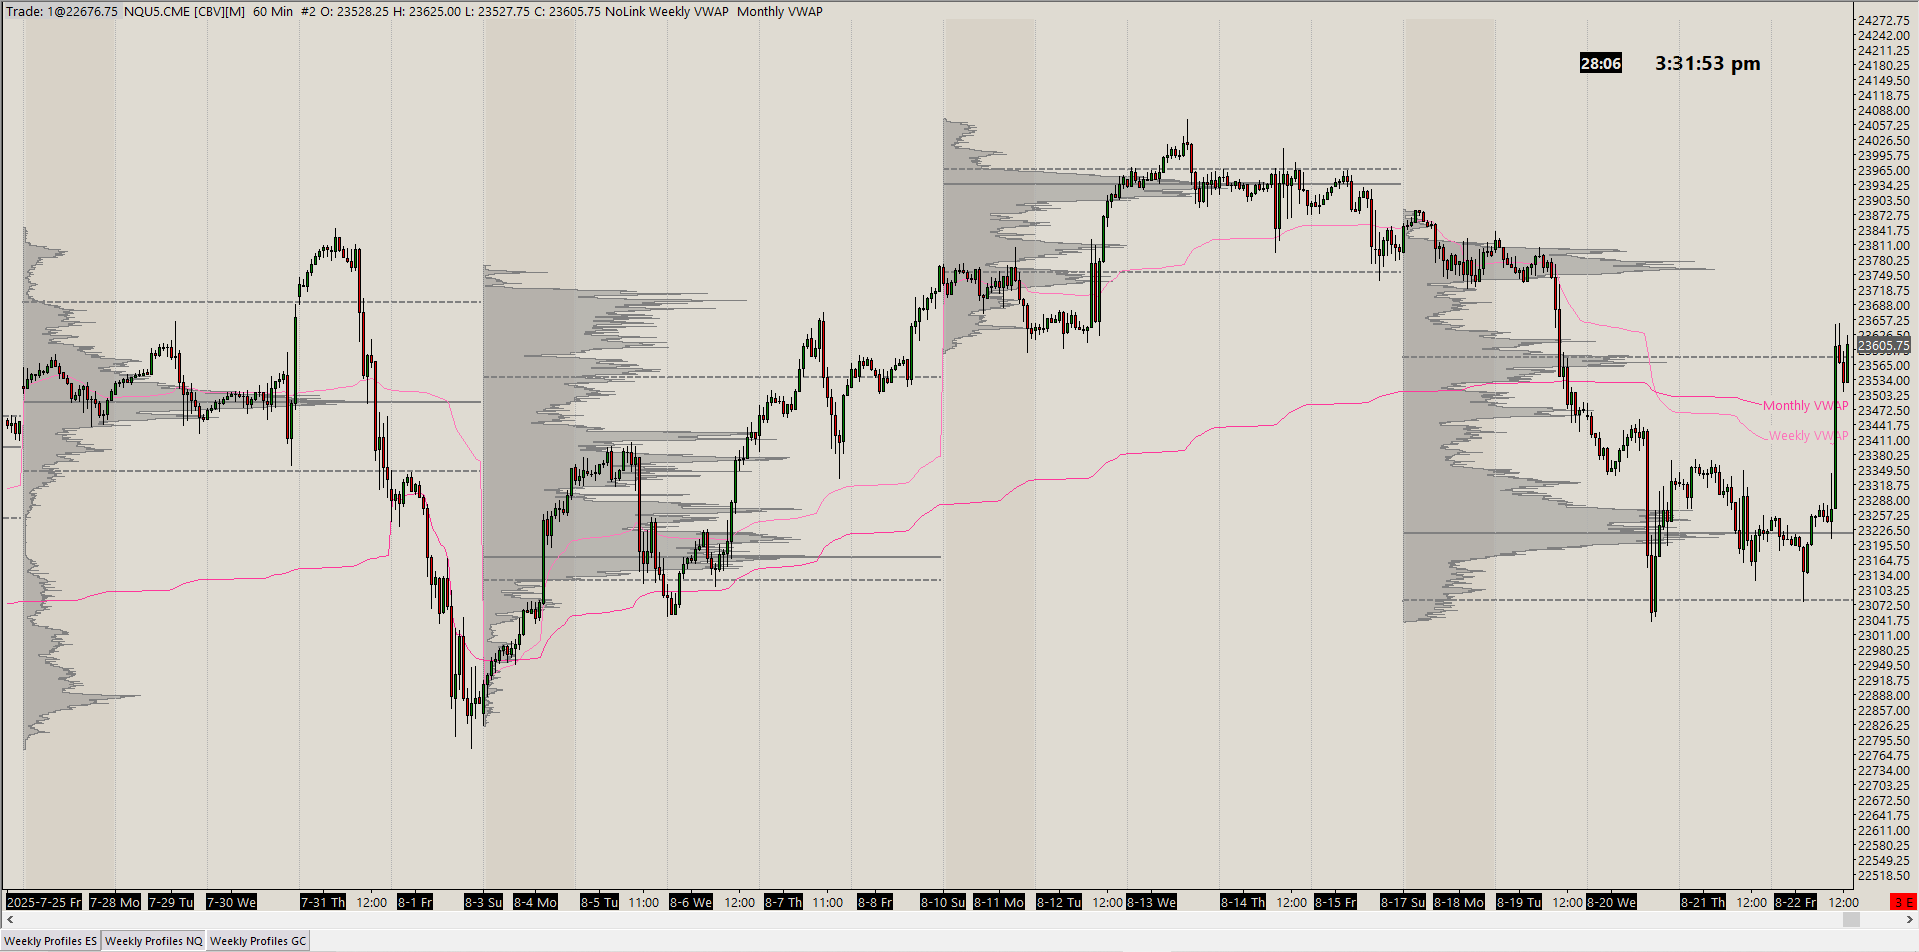
This light themed periodic volume profile chartbook gives you a macro view of the price vs volume relationship with weekly volume profiles on a 1 hour chart for the ES (SP500), NQ (Nasdaq100) and GC (Gold) futures markets. It also has extra studies added as explained below. Timeframes can be customized as needed in the chart settings (bar periods). ES and NQ are set to the current September 2026 expiration contracts and GC to the August 2026 expiration contract.
The color/font settings can be customized under the individual Chart Graphic Settings. They are not set to follow the Global Graphic Settings of your system, but rather the individual chart settings. You may override that by checking the box in the individual Chart Graphic Settings that says “Use Global Graphic Settings instead of these settings” so it will have the same look as all other charts on your system.
All the charts are set to the current contracts. You might need to update them to the current contract at the time you purchase these. There are instruction & videos for installation and troubleshooting at the bottom of the webstore page. You can switch the charts to whatever markets you trade in the Chart Settings -> Symbol menu.
It contains the following indicators and elements applied to it:
Weekly Profiles with outline highlight
Monday background Highlight
Daily start vertical lines (6pm EST)
POC, VAH and VAL lines (solid for POC, dashed for VAs)
Weekly and Monthly VWAP lines
Clock
Countdown timer to next candle
Current price line
All these indicators can be customized and colors changed through each specific study settings option. Under Analysis - Studies.