
LVN Zones Indicator
Automatic Low Volume Node levels from your Volume Profile
Volume Profile is one of the most useful tools on a chart, but the important part is easy to miss in the moment. The real reactions often happen at the thin spots — the low volume nodes between high volume areas. Most traders see them after the fact, or spend the session drawing and adjusting levels by hand while price is already moving especially on lower time frames.
On a developing session profile those shelves keep changing. On a weekly profile they get lost in the noise. You end up with either no levels, or a chart full of lines you no longer trust.
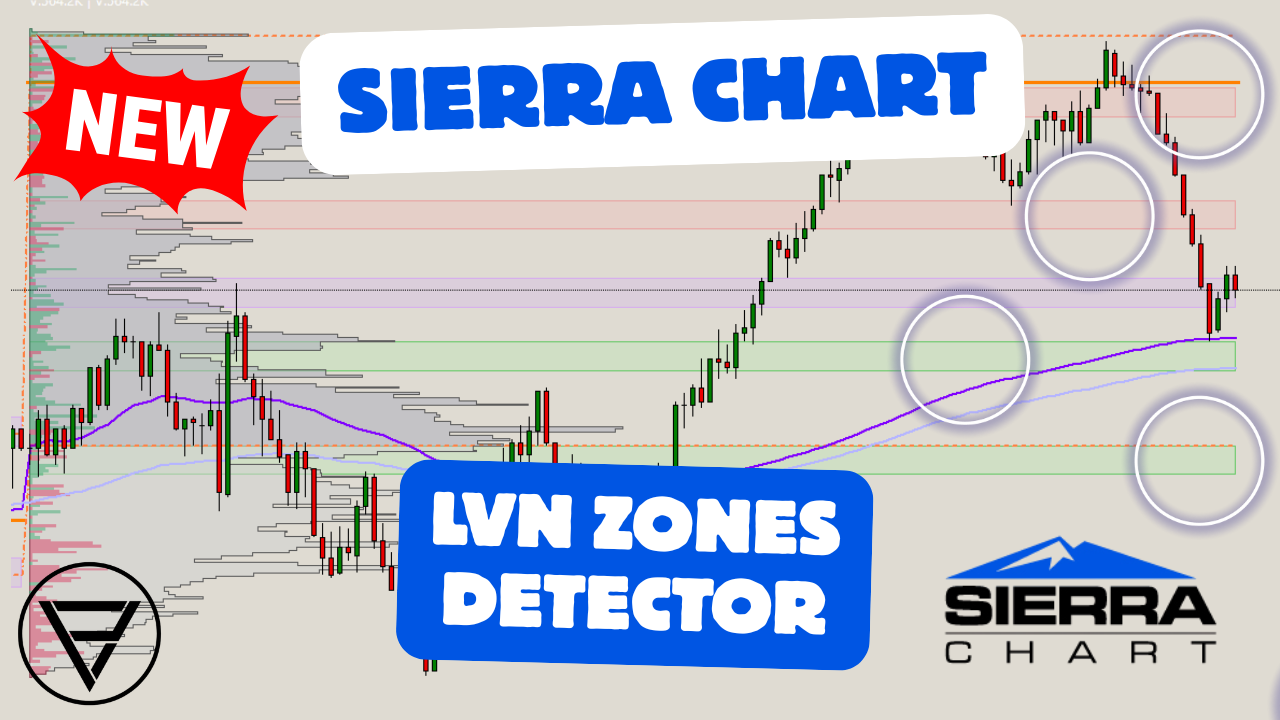
The PAVT LVN Zones is a native Sierra Chart study that reads the Low Volume Nodes from a Volume by Price study you already have applied on the chart and draws them as clean zones on the chart.
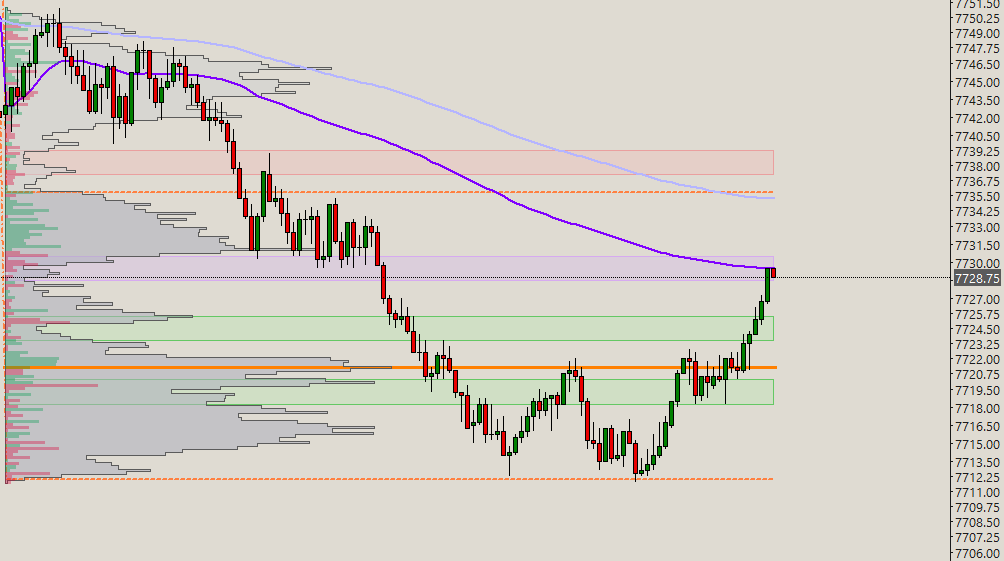
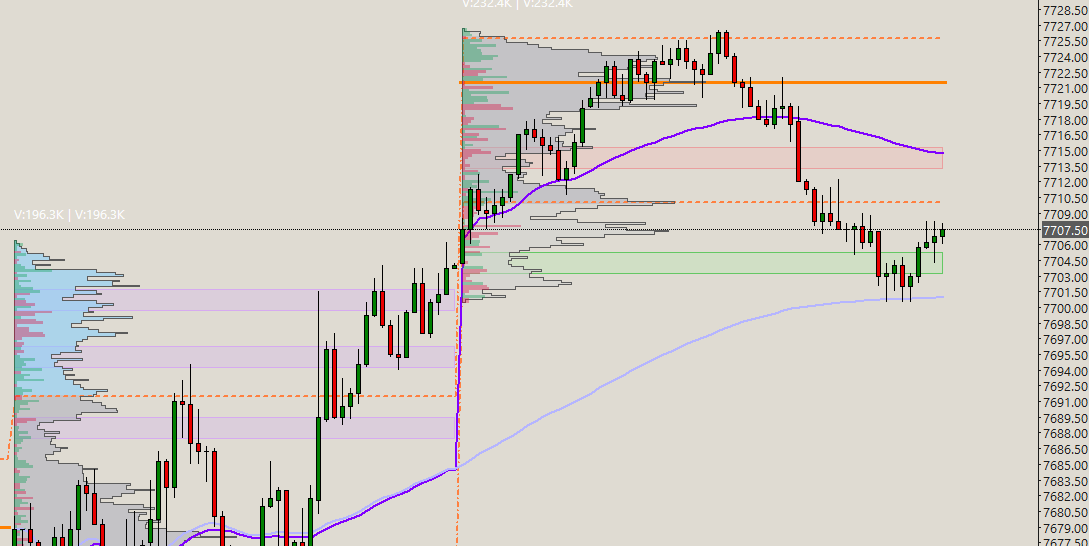
It is built entirely in C++ (ACSIL). No extra platform. No laggy overlay. It turns the profile valleys (as the LVN’s are called in SC) already calculated by Sierra Chart into visible support and resistance zones you can actually trade against. These zones dynamically change colors according to the price location relative to the levels.
Key Features:
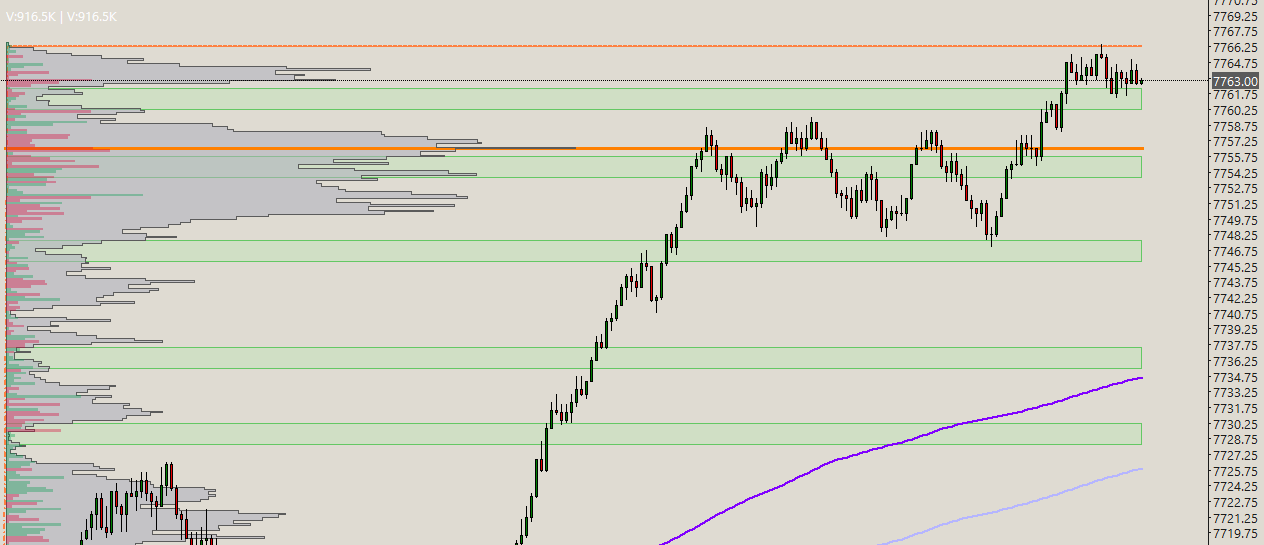
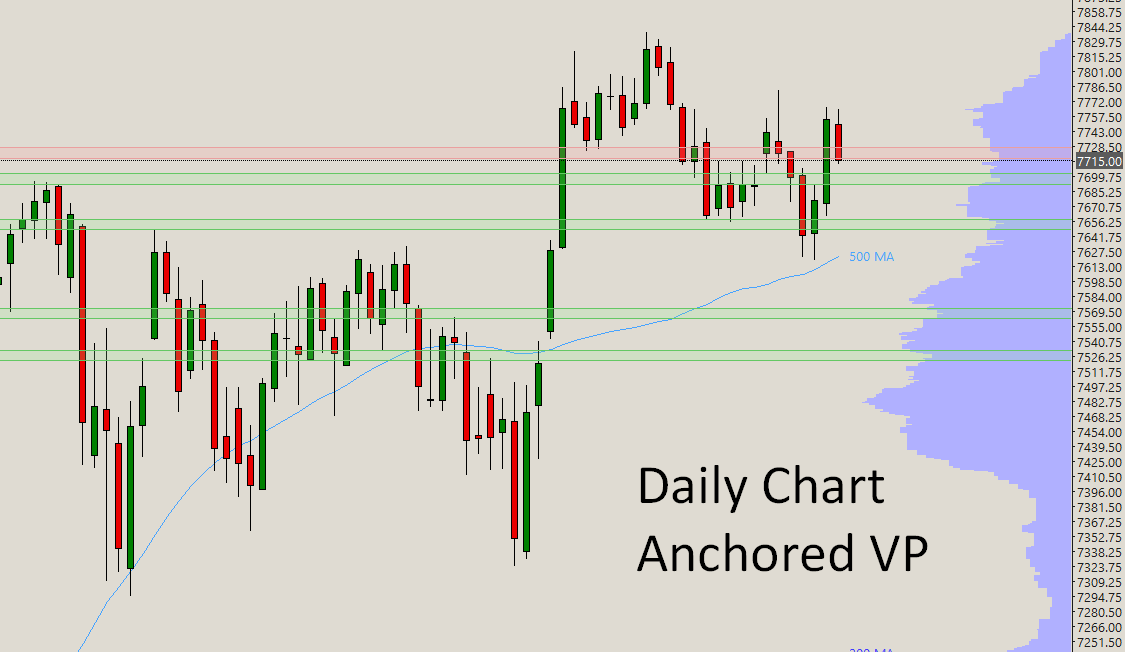
Automatically marks LVN zones from session, weekly, fixed range or any Volume by Price profile applied on a chart
Works on 1min, 5min, 1hour, tick, range, and other chart types (fully customizable)
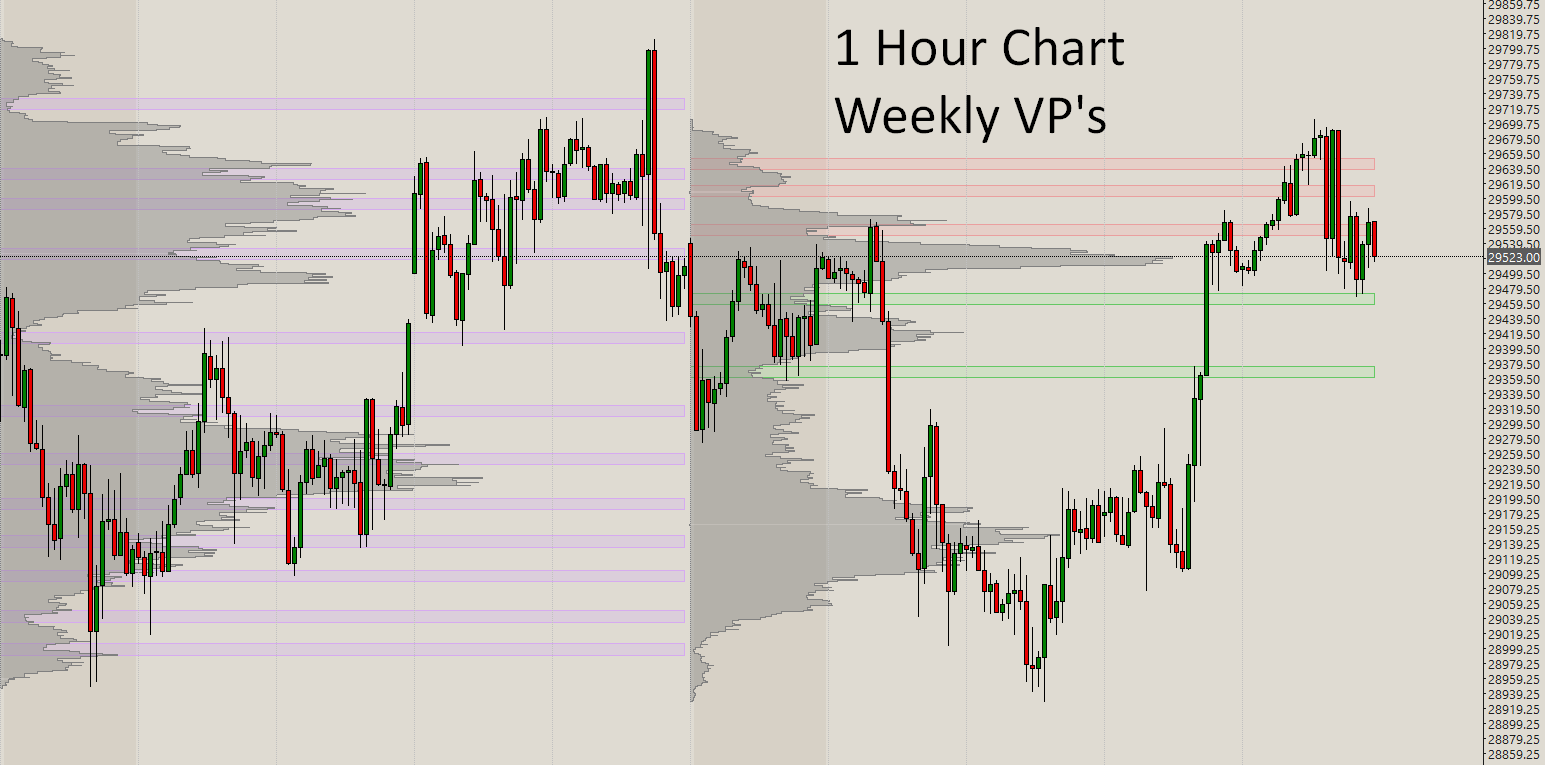
Dynamic colors on the current profile:
Green when price is above the zone
Red when price is below the zone
Purple when price is inside the zone
Finished profiles stay static so old session zones do not keep flipping color
Adjustable sensitivity settings for more/less zones according to personal preference & strategies
Hide ETH or RTH zones when you no longer want the previous session overlapping the new one
Filters for zone height, minimum separation, merge distance, max distance from current price, and ignoring levels too close to the session high/low
Option to keep zones inside the profile or extend them to the right edge
Includes a 6-chart starter chartbook for ES, NQ, and Gold
5-min chart with Session Volume Profiles (ETH & RTH), VWAP, Countdown Timer & Clock
1-hour chart with Weekly Volume Profiles, Monday Background Highlight, Countdown Timer & Clock
Light or Dark theme available, chosen after purchase
LVN Zones study is already added into the chartbook file, so after manual authorization, it is ready to go
Complete video guide going over every setting, best practices for ES/NQ/GC charts and chart examples
This is a level-mapping tool, not an entry signal system. It shows you where the profile is thin. You still decide how to trade those areas according to your strategy.
You keep Sierra’s native Volume Profile and add the missing layer: automatic LVN zones. The included chartbook gets you running immediately. After that, customize the timeframe, colors, sensitivity, and zone filters to your own style.
Pricing: $95 – One-time payment
No monthly subscription. No recurring fees. Lifetime updates.
Mac Users:
Apple Silicon (M1, M2, M3, M4) → Use the file ending in _ARM64.dll
Intel Macs → Use the standard _64.dll (runs via Rosetta)
Windows / Parallels / Windows on Mac → Use the standard _64.dll
The correct file will be provided after purchase based on the operating system you specify. If you have a MAC but run a virtual Windows environment through a specialized program, then use the _64.dll Windows file.
Installation Instructions
1- After purchase, email your Sierra Chart Account Name, operating system (Windows / Intel Mac / Apple Silicon) and light/dark chart theme preference (only one will be included) to the support address provided in your order confirmation or through the contact form on this site.
2- You will receive a reply back (usually within 24 hours) containing:
Private Download link for the study
Authorization confirmation
Short installation & settings video guide
3- Copy the .dll file into your Sierra Chart Data folder (default location: C:\SierraChart\Data)
4- When you first open the provided template the study will already be applied to all 6 charts. But if you wish to add them to other charts of your own or other of my SC templates you can find the study under “Studies - Add Custom Study - PAVT_LVN Zones”.
5- Watch the complete video setup guide as it provides instructions on installation, settings, troubleshooting, etc.
Frequently Asked Questions:
Does this replace the Volume by Price study?
No. You still need a Volume by Price study on the chart. This study reads that profile and draws the LVN zones from it.
Why am I not seeing any zones?
Almost always one of these:
- No Volume by Price study on the chart
- Wrong Study ID linked in PAVT_LVN Zones
- Draw Peaks & Valleys set to None
- Sensitivity still too high, so Sierra is only detecting a few valleys
- Start with the included chartbook first as the volume profiles and study are already linked there. Watch the video guide as it addresses many troubleshooting issues
Can I use it on tick charts?
Yes. It works on time-based, tick, volume, and range charts as long as the Volume by Price study is calculating on that chart and linked in the study settings.
Does it work on ES, NQ, and Gold?
Yes. The starter chartbook includes all three. You can also add the study to CL, YM, or other instruments once a Volume by Price study is on the chart.
What is the difference between session and weekly zones?
Session zones are for day trading context on the 5-min chart (or any lower timeframe you prefer). Weekly zones on the 1-hour chart give the larger profile levels and great for daily bias or longer swing trading.
Can I use this indicator on my own longer term Fixed Range Volume Profiles?
Yes. As long as the Volume Profile ID is correctly linked in the study settings it will plot the LVN Zones on that chart.
Can I hide overnight zones after the New York session starts?
Yes. There are separate Hide ETH Zones and Hide RTH Zones inputs.
Can I customize the chartbook?
Yes. The chartbook is a starting template. Change the timeframe, instruments, colors, Volume Profile settings, and LVN filters to your own style.
Is this compatible with other custom studies?
Yes. It can run alongside your other PAVT indicators/templates and most third-party studies.
Do you offer refunds?
Because this is a digital product that is authorized to your Sierra Chart account, all sales are final once the file download link has been delivered and authorization given.
Will there be updates?
Yes. Any future improvements or bug fixes will be provided free of charge to existing customers.
Terms of Use & License Agreement – PAVT LVN Zones Indicator
By purchasing and downloading this study you agree to the following terms:
License Grant: You are granted a personal, non-exclusive, non-transferable license to use the study on Sierra Chart installations linked to your authorized Sierra Chart Account Name.
Permitted Use: The study is for personal discretionary trading only. It may not be used for automated trading systems, signal services, or commercial redistribution.
Prohibited Actions:
Reverse engineering, decompiling, or modifying the study
Sharing, selling, or redistributing the files
Attempting to bypass the authorization system
Using the study on unauthorized Sierra Chart accounts
No Warranty: The software is provided “as is”. Price Action Volume Trader makes no guarantees regarding performance, profitability, or uninterrupted operation. Trading involves substantial risk of loss.
Limitation of Liability: Under no circumstances shall Price Action Volume Trader be liable for any trading losses, account damages, or other damages arising from the use or inability to use this study.
Termination: Violation of these terms will result in immediate revocation of the license. You must then delete all copies of the study.
Refund Policy: All sales are final once the study files and authorization have been delivered.
Governing Law: These terms are governed by the laws of the applicable jurisdiction.
Risk Disclaimer
Trading futures and other leveraged financial instruments involves a substantial risk of loss and is not suitable for all investors. You can lose more than your initial investment. Past performance is not indicative of future results.
PAVT LVN Zones is a charting tool that highlights low volume node areas from a Volume by Price study. It does not generate trade signals, does not guarantee that price will react at any zone, and does not prevent losses. You are solely responsible for all trading decisions and for the consequences of those decisions.
Price Action Volume Trader assumes no responsibility for any losses incurred while using this study. By using this software you acknowledge that you understand the risks involved in trading and agree that you are using the tool entirely at your own risk.